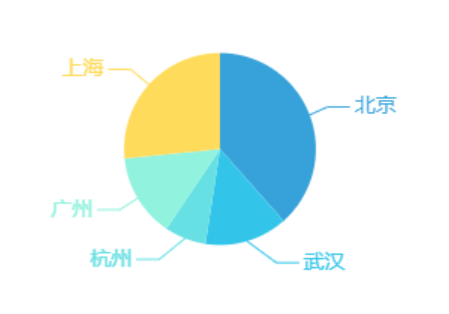
微信小程序:Echarts饼图
来自CloudWiki
下载
为了兼容小程序 Canvas,我们提供了一个小程序的组件,用这种方式可以方便地使用 ECharts。
首先,下载 GitHub 上的 ecomfe/echarts-for-weixin 项目:https://github.com/ecomfe/echarts-for-weixin
其中,ec-canvas 是我们提供的组件,其他文件是如何使用该组件的示例。
将下载好的文件中 ec-canvas目录 放在小程序项目目录中即可
.
引入组件
首先,在 pages/bar 目录下新建以下几个文件:index.js、 index.json、 index.wxml、 index.wxss。并且在 app.json 的 pages 中增加 'pages/pie/index'。
index.json 配置如下:
{
  "usingComponents": {
    "ec-canvas": "../../ec-canvas/ec-canvas"
  }
}
这一配置的作用是,允许我们在 pages/pie/index.wxml 中使用 <ec-canvas> 组件。注意路径的相对位置要写对,如果目录结构和本例相同,就应该像上面这样配置。
在 index.js 中引入echarts.js
import * as echarts from '../../ec-canvas/echarts';
代码
WXML
<!--pages/bar/index.wxml-->
<view class="echart_panel">
    <ec-canvas ec="{{ ecLine }}"></ec-canvas>
  </view>
WXSS
/* pages/bar/index.wxss */
.echart_panel{
  width:100%;
  height:500rpx;
}
JS
// pages/bar/index.js
import * as echarts from '../../ec-canvas/echarts';
function getOption(xData, data_cur, data_his) {
  var option = {
    backgroundColor: "#ffffff",
    color: ["#37A2DA", "#32C5E9", "#67E0E3", "#91F2DE", "#FFDB5C", "#FF9F7F"],
    series: [{
      type: 'pie',
      label: {
        normal: {
          fontSize: 14
        }
      },

      center: ['50%', '50%'],
      radius: [0, '60%'],
      data: [{
        value: 55,
        name: '北京'
      }, {
        value: 20,
        name: '武汉'
      }, {
        value: 10,
        name: '杭州'
      }, {
        value: 20,
        name: '广州'
      }, {
        value: 38,
        name: '上海'
      },
      ],
      itemStyle: {
        emphasis: {
          shadowBlur: 10,
          shadowOffsetX: 0,
          shadowColor: 'rgba(0, 2, 2, 0.3)'
        }
      }
    }]
  };

  return option;
}
let chartLine;
Page({
    data: {
        ecLine: {
            onInit: function (canvas, width, height){
                //初始化echarts元素,绑定到全局变量,方便更改数据
                chartLine = echarts.init(canvas, null, {
                    width: width,
                    height: height
                });
                canvas.setChart(chartLine);


                var option = getOption();
                chartLine.setOption(option);


            }
        }
    }
})

