Echarts数据展示
来自CloudWiki
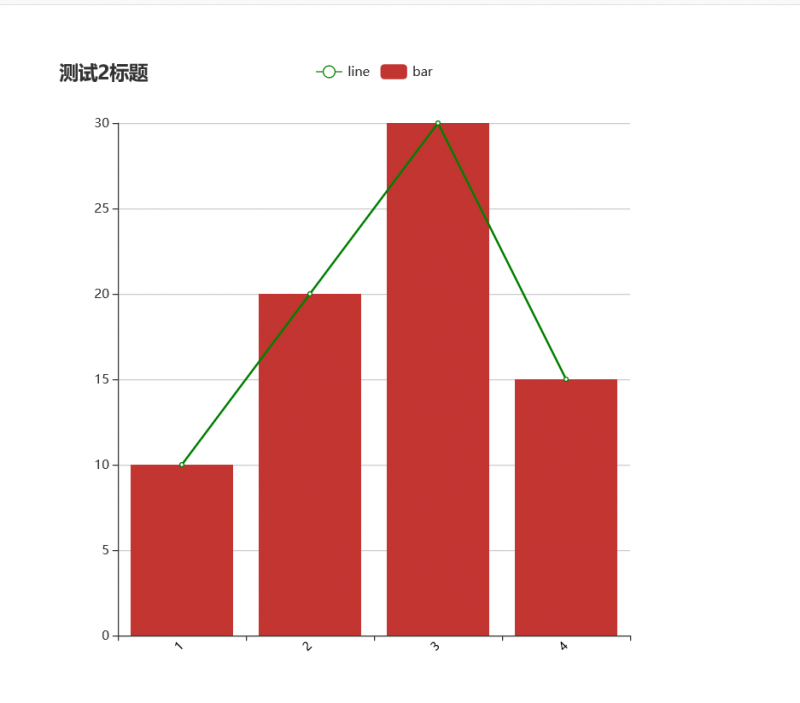
柱状图折线图
<script src="https://cdn.staticfile.org/echarts/4.3.0/echarts.min.js"></script>
   <script>
       var myChart = echarts.init(document.getElementById("main"));
       var option = {

           title:{
               text:"测试2标题"
           },
           legend:{
           data:["line","bar"]
           },
           xAxis: {
               data:["1","2","3","4"],
                           axisLabel: {
                           interval: 0,    //强制文字产生间隔
                           rotate: 45,     //文字逆时针旋转45°
                           textStyle: {    //文字样式
                                       color: "black",
                                       fontSize: 11,
                                       fontFamily: 'Microsoft YaHei'
                                       }}
           },
           yAxis:{

           },
           series:[
               {name:"line",
               type:"line",
                   color:"green",
                   data: [10,20,30,15]
               },{
               name:"bar",
                   type: "bar",

                   data: [10,20,30,15]
               }

           ]
       };
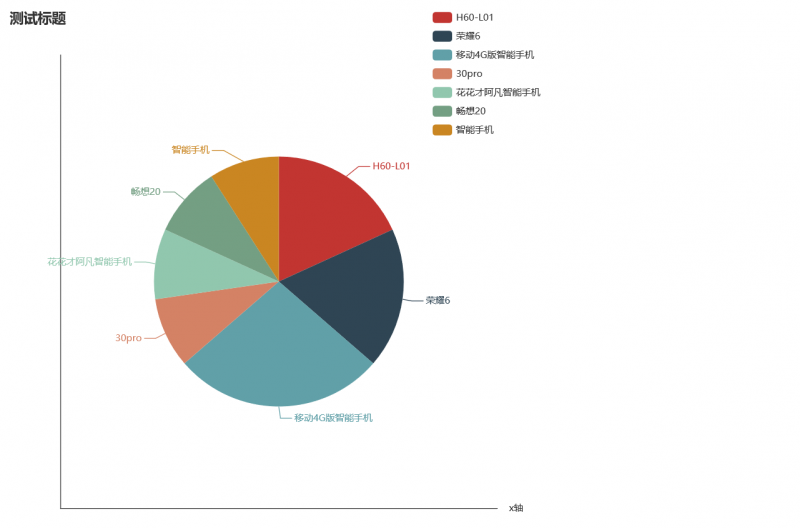
饼图
       var myChart2 = echarts.init(document.getElementById("two"));
       var option2 = {
           title:{
               text:"测试标题"
           },
           legend: {     orient: 'vertical',
           right: 10,  data:["H60-L01","荣耀6","移动4G版智能手机","30pro","花花才阿凡智能手机","畅想20","智能手机"]},
           xAxis: {


               name:"x轴"
           },
           yAxis: {},
           series:[{name: "bing",
           type: "pie",

                radius:160,
           data: [
               {name:"H60-L01", value:2},
               {name:"荣耀6", value:2},
               {name:"移动4G版智能手机", value:3},
               {name:"30pro", value:1},
               {name:"花花才阿凡智能手机", value:1},
               {name:"畅想20", value:1},
               {name:"智能手机", value:1}
           ]

           }]
       };

