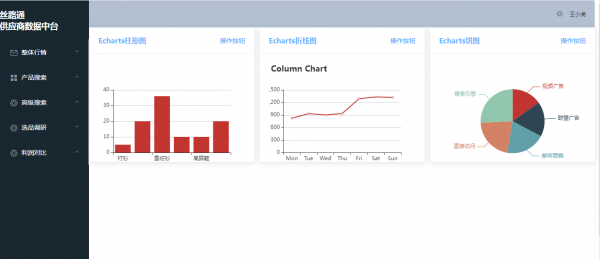
Element+Echarts:模块化开发中使用可视化卡片
来自CloudWiki
目录
项目背景
实训步骤
安装Echarts
在项目本身目录下执行
npm install echarts@4
在intro.vue文件中分别编写如下部分代码:
html代码
<template>
	<div id="app">
		<el-row :gutter="12">
			<el-col :span="8">
				<el-card class="box-card" style="height: 300px">
					<div slot="header" class="clearfix">
						<span class="charts_title">Echarts柱形图</span>
						<el-button style="float: right; padding: 3px 0" type="text">操作按钮</el-button>
					</div>
					<div id="chartColumn" style="width: 100%; height: 260px;">
					</div>
				</el-card>
			</el-col>
			<el-col :span="8">
				<el-card class="box-card" style="height: 300px">
					<div slot="header" class="clearfix">
						<span class="charts_title">Echarts折线图</span>
						<el-button style="float: right; padding: 3px 0" type="text">操作按钮</el-button>
					</div>
					<div id="chartColumn2" style="width: 100%; height: 260px;">
					</div>
				</el-card>
			</el-col>
			<el-col :span="8">
				<el-card class="box-card" style="height: 300px">
					<div slot="header" class="clearfix">
						<span class="charts_title">Echarts饼图</span>
						<el-button style="float: right; padding: 3px 0" type="text">操作按钮</el-button>
					</div>
					<div id="chartPie" style="width: 100%; height: 260px;">
					</div>
				</el-card>
			</el-col>
		</el-row>


	</div>
</template>
js代码
<script>
	import * as echarts from "echarts";

	export default {

		data() {
			return {
				chartColumn: null,
				chartColumn2: null,
				chartPie: null,
			}
		},
		mounted() {
			this.drawLine();
			this.drawLine2();
			this.drawPie();
		},
		methods: {
			drawLine() {
				this.chartColumn = echarts.init(document.getElementById('chartColumn'));

				this.chartColumn.setOption({
					title: {
						text: ''
					},
					tooltip: {},
					xAxis: {
						data: ['衬衫', '羊毛衫', '雪纺衫', '裤子', '高跟鞋', '袜子']
					},
					yAxis: {},
					series: [{
						name: '销量',
						type: 'bar',
						data: [5, 20, 36, 10, 10, 20]
					}]

				});
			},
			drawLine2() {
				this.chartColumn2 = echarts.init(document.getElementById('chartColumn2'));

				this.chartColumn2.setOption({
					title: {
						text: 'Column Chart'
					},
					tooltip: {
						trigger: "axis",
						axisPointer: {
							type: "cross",
							label: {
								backgroundColor: "#76baf1"
							}
						}
					},
					xAxis: {
						type: 'category',
						data: ['Mon', 'Tue', 'Wed', 'Thu', 'Fri', 'Sat', 'Sun']
					},
					yAxis: {
						type: 'value'
					},
					series: [{
						data: [820, 932, 901, 934, 1290, 1330, 1320],
						type: 'line'
					}]
				});
			},
			drawPie() {
				this.chartPie = echarts.init(document.getElementById('chartPie'));

				this.chartPie.setOption({
					series: [{
						name: '访问来源',
						type: 'pie', // 设置图表类型为饼图
						radius: '55%', // 饼图的半径,外半径为可视区尺寸(容器高宽中较小一项)的 55% 长度。
						data: [ // 数据数组,name 为数据项名称,value 为数据项值
							{
								value: 235,
								name: '视频广告'
							},
							{
								value: 274,
								name: '联盟广告'
							},
							{
								value: 310,
								name: '邮件营销'
							},
							{
								value: 335,
								name: '直接访问'
							},
							{
								value: 400,
								name: '搜索引擎'
							}
						]
					}]
				});
			},

		},

	}
</script>
css 代码
<style>
	.title {
		font-size: 20px;
		line-height: 50px;
	}

	.text {
		font-size: 14px;
	}

	.charts_title {
		font-weight: bold;
		color: #66B1FF;
	}

	.item {
		margin-bottom: 18px;

	}

	.clearfix:before,
	.clearfix:after {
		display: table;
		content: "";
	}

	.clearfix:after {
		clear: both
	}

	.box-card {
		width: 100%;
		height: 300px;
	}
</style>
intro.js的 全部代码
<template>
	<div id="app">
		<el-row :gutter="12">
			<el-col :span="8">
				<el-card class="box-card" style="height: 300px">
					<div slot="header" class="clearfix">
						<span class="charts_title">Echarts柱形图</span>
						<el-button style="float: right; padding: 3px 0" type="text">操作按钮</el-button>
					</div>
					<div id="chartColumn" style="width: 100%; height: 260px;">
					</div>
				</el-card>
			</el-col>
			<el-col :span="8">
				<el-card class="box-card" style="height: 300px">
					<div slot="header" class="clearfix">
						<span class="charts_title">Echarts折线图</span>
						<el-button style="float: right; padding: 3px 0" type="text">操作按钮</el-button>
					</div>
					<div id="chartColumn2" style="width: 100%; height: 260px;">
					</div>
				</el-card>
			</el-col>
			<el-col :span="8">
				<el-card class="box-card" style="height: 300px">
					<div slot="header" class="clearfix">
						<span class="charts_title">Echarts饼图</span>
						<el-button style="float: right; padding: 3px 0" type="text">操作按钮</el-button>
					</div>
					<div id="chartPie" style="width: 100%; height: 260px;">
					</div>
				</el-card>
			</el-col>
		</el-row>


	</div>
</template>

<script>
	import * as echarts from "echarts";

	export default {

		data() {
			return {
				chartColumn: null,
				chartColumn2: null,
				chartPie: null,
			}
		},
		mounted() {
			this.drawLine();
			this.drawLine2();
			this.drawPie();
		},
		methods: {
			drawLine() {
				this.chartColumn = echarts.init(document.getElementById('chartColumn'));

				this.chartColumn.setOption({
					title: {
						text: ''
					},
					tooltip: {},
					xAxis: {
						data: ['衬衫', '羊毛衫', '雪纺衫', '裤子', '高跟鞋', '袜子']
					},
					yAxis: {},
					series: [{
						name: '销量',
						type: 'bar',
						data: [5, 20, 36, 10, 10, 20]
					}]

				});
			},
			drawLine2() {
				this.chartColumn2 = echarts.init(document.getElementById('chartColumn2'));

				this.chartColumn2.setOption({
					title: {
						text: 'Column Chart'
					},
					tooltip: {
						trigger: "axis",
						axisPointer: {
							type: "cross",
							label: {
								backgroundColor: "#76baf1"
							}
						}
					},
					xAxis: {
						type: 'category',
						data: ['Mon', 'Tue', 'Wed', 'Thu', 'Fri', 'Sat', 'Sun']
					},
					yAxis: {
						type: 'value'
					},
					series: [{
						data: [820, 932, 901, 934, 1290, 1330, 1320],
						type: 'line'
					}]
				});
			},
			drawPie() {
				this.chartPie = echarts.init(document.getElementById('chartPie'));

				this.chartPie.setOption({
					series: [{
						name: '访问来源',
						type: 'pie', // 设置图表类型为饼图
						radius: '55%', // 饼图的半径,外半径为可视区尺寸(容器高宽中较小一项)的 55% 长度。
						data: [ // 数据数组,name 为数据项名称,value 为数据项值
							{
								value: 235,
								name: '视频广告'
							},
							{
								value: 274,
								name: '联盟广告'
							},
							{
								value: 310,
								name: '邮件营销'
							},
							{
								value: 335,
								name: '直接访问'
							},
							{
								value: 400,
								name: '搜索引擎'
							}
						]
					}]
				});
			},

		},

	}
</script>
<style>
	.title {
		font-size: 20px;
		line-height: 50px;
	}

	.text {
		font-size: 14px;
	}

	.charts_title {
		font-weight: bold;
		color: #66B1FF;
	}

	.item {
		margin-bottom: 18px;

	}

	.clearfix:before,
	.clearfix:after {
		display: table;
		content: "";
	}

	.clearfix:after {
		clear: both
	}

	.box-card {
		width: 100%;
		height: 300px;
	}
</style>
编写侧边栏 和顶部组件
请参考[[创建带路由的Element项目
编写App.vue
请参考[[创建带路由的Element项目
编写router/index.js
请参考[[创建带路由的Element项目
编写main.js
请参考[[创建带路由的Element项目
运行效果
运行项目,浏览器打开http://localhost:8080/#/intro
